
2025 MLS Season Preview Part 2: Roster Churn and Transfer Spending
For the loser now / Will be later to win / For the [rosters] they are a-changin'

In the first part of this season preview, I looked at how things stood after the 2024 season: how teams played and how well they did. A lot has changed between then and now, so today we’re going to continue by looking at roster changes.
There’s still going to be at least one more article in this series that covers designated players. They’re the most important players on most team’s rosters, but I’m saving them until most of the transfer drama has settled down. Make sure to subscribe and get that in your inbox.
For today, I’m going to start by looking closely at outgoing players, then move on to see what we can say about the players teams have added.
A reminder: I’d like to think I’m a bit of an expert about DC United, but I know very little about the other 29 teams in MLS and even less about players from outside the league. I can’t tell you which young player is ready to shine or which obscure player is going to surprise now that he’s in exactly the right system. And I definitely can’t tell you which high-priced acquisitions were good buys and which are likely to fail.
In short, I can’t predict what will happen when the regular season begins next weekend. Instead, I’m trying to help you understand what’s happened leading up to it so that as the games begin, you can better understand the games you’re watching.
Roster Churn
Every single team’s roster has changed since 2024. Some team previews will list the players that left and the players added. However, the end of an MLS team’s roster usually has a lot players who—for whatever reason—contributed virtually nothing to the team’s previous campaign.
Last time, I characterized each team (except San Diego) as ending 2024 with a certain quality level of offense, defense, and goalkeeping. What I want to figure out today is how much change to expect. If nothing much has changed, then I can tentatively expect similar performance. Yeah, of course young players might get a bit better, old players might get a bit worse, and injuries will hit differently, but just as a starting point…no changes? Then, probably about the same!
On the other hand, if there’s huge turnover, I may not be able to predict how new players will do, but I can at least anticipate more likelihood of change. We can also get a tiny bit of insight into how a team’s general manager is thinking about the situation if they’re making big changes.
To help answer this question, Eliot McKinley of American Soccer Analysis has been posting charts showing what percentage of minutes were played in 2024 by players still on the roster in 2025.
I have my own data set for this. It’s up to date for all player moves that were official as of the end of Saturday, February 15. Except I added Evander leaving Portland because it’s a really big deal and it seems nearly certain to happen. Other rumored moves, though, like Santi Rodriguez leaving NYCFC, are not included yet.
Edit 2/19: I’ve updated the charts in this article to bring them up to date, so they now include official numbers for Evander and David da Costa, as well as some other late-breaking transactions. I will try to update a few more times before the window closes, but no guarantees.
Edit 2/27: Updated again, so the charts now include the Santi Rodríguez and Micael sales from NYCFC and Houston respectively, plus a couple other moves like Philly spending GAM on Indiana Vassilev.
Okay, so here’s my version:
These numbers don’t match Eliot McKinley’s numbers and it’s not just because I have a few more days of movement. There are a lot of minor differences that could be down to different ways of measuring 2024 minutes, but there are some big differences as well with teams like NYCFC and FC Dallas. I did by best to double check and couldn’t find anything on my side to explain the discrepancies. It could be mistakes on my part or on his part, or both. All this stuff is for entertainment purposes only, please do not make major life decisions based on my charts!
Oh, and send all complaints to MLS HQ, not to me or Eliot, because it’s their fault there aren’t authoritative, real-time updated rosters available.
Those caveats aside, what do these numbers tell us? In general, you’d expect to see bad teams turning over more of their rosters, so it’s not too surprising that New England, FC Dallas, and DC United have the biggest changes. On the other side, some 50+ point teams like Seattle, Orlando, and Colorado are mostly staying put.
The big surprises, to me, are LAFC making big changes after winning the Western Conference and then Toronto FC making so few changes. Toronto apparently has been playing a game of chicken with Lorenzo Insigne, trying to get him to leave, and I think Tom Bogert has reported they’re blinking first and are about to make some moves. That hasn’t happened yet, but if it takes the form of players leaving when it does, Portland might become the most surprising team at the high end.
Now when I characterize Portland as not making changes, you might have raised your eyebrows. They sold one of the league’s best players to FC Cincinnati! Obviously, not all minutes are created equal. The Crew might be near the middle of this chart, but losing Cucho’s minutes is a devastating loss, especially since—so far—he hasn’t really been replaced.
Offense Churn
There’s at least three ways I could try to capture major changes like selling Cucho. I could just track Designated Players separately since they’re so important, I could try to separate out retained minutes by the offense, or I can look at retained goals and assists.
The next post in this series, hopefully coming in a few days, will look at DPs in particular, so for this one I decided to try the other two approaches.
First, retained minutes from offensive players. To do this, I had to distinguish who plays “for the offense” which—apart from a handful of guys like Messi—isn’t really a valid distinction in modern soccer. We’ll have to look at positions and just make a ballpark characterization. FBref already does this, classifying players’ 2024 seasons as “FW”, “MF”, “DF”, or “GK”. Sometimes it will include two of them, but the one it lists first is where the player played the most.
What I decided to do was categorize FBref “FW” and “MF” players as offense. This is definitely not perfect. It includes “destroyer” central midfielders as offense and it considers wingbacks as defense. I also don’t fully trust FBref’s position indications. But for DC United, the team I understand really well, this does a good enough job, so hopefully that’s true for most teams.
Let’s see how things fall out:
If you read the first post in this series, you’ll recall my practice is to assign teams to groups instead of using absolute numbers. I couldn’t easily fit the grouping names into this kind of chart, but from the colors you can see how I grouped the teams.
This chart confirms some things we would have already guessed from the overall minutes chart (New England making big changes to a bad offense, LAFC making big changes to a good one) but now Columbus and Real Salt Lake stand out better as making some big changes to good offenses. Minnesota United meanwhile is now near the top of the list, since most of their outgoing player-minutes were apparently defenders.
The other option I mentioned was ignoring minutes and thinking about goals and assists. There’s a certain purity to this, especially the focus on goals. Soccer offense is literally about scoring goals. If someone who scored 5 goals is off the roster, either someone on the roster needs to score 5 more goals than they did the previous season, a newcomer needs to score 5 goals, or some combination of the two. Otherwise, the offense is going to be 5 goals worse than it was the previous season.
Plenty of players make important contributions to offense without scoring goals, though, so at least we can add assists. I was slightly tempted to look at retention of some advanced stat like shot-creating actions here, but as mentioned in the last article, I think the traditional stats have some real virtues for this kind of analysis. For example, when going into detail on replacing Mateusz Klich’s “shot-creating actions” for my DC United newsletter, I realized a lot of these came from being the designated free kick taker. He’s probably better at free kicks than whoever will take them instead of him, but just by being the free kick taker, a player will create more shots than if he isn’t.
So let’s keep it simple. Which teams have a lot of goals and assists to replace?
I like that this doesn’t rely on dubious FBref position classification and it underlines the impact of big name DP changes. I don’t have historical data on this to compare (at least not yet, that might be a fun project to do at some point), but this offseason has got to be unusual in how many top attacking players have either left the league or switched teams. The new cash transfer rule is playing a big role there, but also the league seems culturally to be moving towards more of an NBA vibe where MVP candidates like Lucho Acosta and Evander can force themselves off teams if they want.
But at the end of the day, this is quite similar to the previous minutes-based chart. I decided to stick with offense minutes played as the change indicator I’ll be using for offense. I like the fact it recognizes midfielder contributions, and as we’ll see this will keep it symmetrical with my measurement of defensive churn.
Defense Churn
There was no equivalent of G+A to try here. Unfortunately, soccer defense is hard to “see” with statistics. The advanced stats for it are mostly counting stats that are easier to rack up on bad teams or else measures that combine high subjectivity with very low sample sizes, like duel and tackle win rates. American Soccer Analysis has a metric called G+ that incorporates some defensive qualities, but although that’s a really cool project, over the years I just haven’t found much correspondence between what it says and my “eye test” assessments of DC United defenders. That’s not any kind of slight on ASA, they do amazing work with the data they have. There’s just not enough public data to work with, in my opinion.
That brings me back to minutes played. The same caveats about positions still apply. And just as a central defender good at line-breaking passes can help the offense, midfielders do a ton of work to help the defense. But looking at central defenders, fullbacks, and wingback minutes tells us something.
So now looking at the minutes played by “defensive” players, how many of those were retained by each team?
I think it’s interesting that there’s a lot more correspondence here with my goals against groupings. The five teams with lots of churn here were all “Very Bad” or “Bad” on defense in my last article. The five teams with very high retention were likewise “Decent” or “Great”…except the Portland Timbers, who were “Below Average”. Toronto also strikes again with high retention from its bad defense.
Goalkeepers
With goalkeepers, matters are comparatively simple. We know exactly who the goalkeepers are, for one thing. And most teams have a clear #1 goalkeeper who played the majority of their minutes in 2024. It’s pretty simple to ask: is that guy still on the roster or not? In the vast majority of cases, the answer is yes. Who knows, maybe he’s going to get demoted during training camp…but probably not.
Every starter doesn’t play every minute, though, so it’s still worth taking a peak at the minutes graph:
DC United is the only team in the league to fire every goalkeeper who took the field for them in 2024 (Alex Bono and Tyler Miller). They even fired both backups for good measure. I didn’t think Bono was that bad, but statistically, there’s a lot of justification for burning it all down and starting over.
Sporting KC let go of Tim Melia after a poor shotstopping season. He’s 38, so that may be the end of the line, but it doesn’t seem like he’s officially retired yet. Steve Clark is in the same boat, also 38 and let go by Houston after…checks notes…posting the league’s third-best shotstopping stat in 2024. Interesting! Taking a quick look online, Houston fans seemed happy to see him go, so either they don’t “know ball” or the shotstopping stat is imperfect. Or both.
San Jose’s starting goalkeeper, Daniel, missed most of 2024 with a hamstring injury. William Yarbrough played the majority of the minutes in his absense, posted pretty bad shotstopping numbers, and was let go.
Those are the only teams big changes. Then there’s various clubs who are doing the usual backup goalkeeper musical chairs.
One thing this chart conceals is that although the Philadelphia Union retained 100% of the goalkeeper minutes, that’s another one where Andre Blake is the clear #1 goalkeeper but missed so much time due to injuries and national team duty that backup Oliver Semmle played the most minutes in 2024. Blake had better shotstopping stats and still seems like the #1, so if he can stay healthy, there’s reason to expect improved Philadelphia to have somewhat improved goalkeeping this year.
Churn Rundown
Before we move on to inbound transfers, let’s put the retention side-by-side with 2024 performance from my previous article:
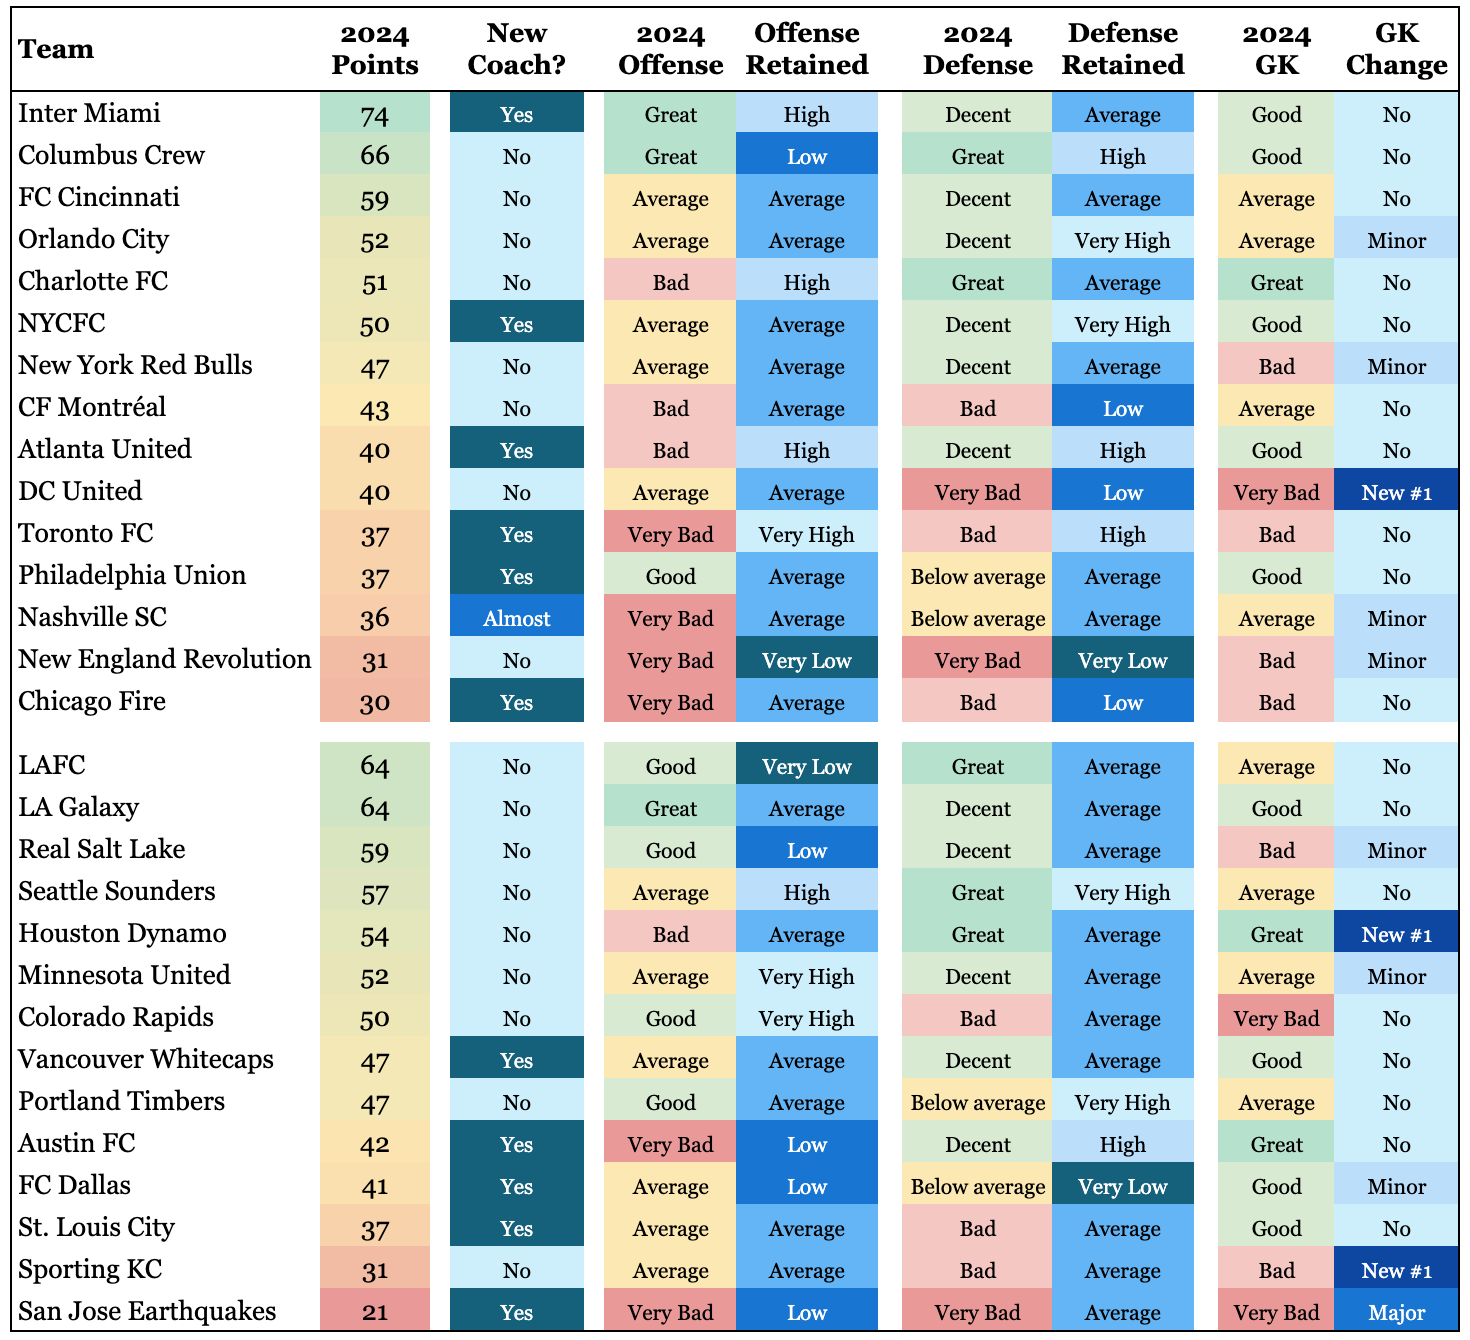
I also included coaching changes, since that’s another obvious source of change. Nashville changed coaches during last season but BJ Callahan only arrived in late July, so I gave them partial credit.
I think this is a good start at seeing how things are changing, but there’s an obvious missing element. Atlanta United is listed as high retention for offense, but we all know there’s big changes in store for their attack.
Inbound Players
I’ve got another annoying warning here at the outset. This time, I want to say that a lot of player movement discussion tries to figure out who’s running the best business: buying low, selling high, etc. Another strain of commentary tries to address (or amplify) fan anxiety about their team ownership’s “ambition” or lack thereof.
I’m not immune to those anxieties, but for this project, I don’t care about who’s making money they can use in the future. I also don’t care which owners are spending and which are cheaping out. I’m just trying to figure out which teams are going to be different than last year. That’s going to be hard enough.
For one thing, there are a ton of different mechanisms that can be used to add players, none of which are commensurate. You could do an economics dissertation about the way the money most teams use to pay a foreign transfer fee is dollars, but those dollars aren’t worth as much as GAM dollars. GAM dollars are special dollars that effectively change your salary cap space, so they’re worth more. Except you can, and teams do, use GAM money to pay part or all of a transfer fee, in which case…they are worth exactly the same.
There’s also two trading windows and the main one goes well beyond the start of the regular season. I’m writing this preview with a week before the season begins and Toronto hasn’t made any moves yet! All well and good if they’re standing pat, but as I mentioned, we’re told they fully intend to make moves this window. Maybe it’s coming, maybe it’s not, but there’s no way to know as we start the season.
There’s also a ton of roster churn each season involving players who—sorry, I’m going to be blunt—simply don’t matter. We can all agree on that, but which players don’t matter and which players are actually going to make an impact? There are almost a thousand players, how should I know? I said I don’t care about business stuff, but money changing hands is the only available guide for how important a player is.
Then once you start trying to watch the money, you run into MLS teams and their “undisclosed transactions”. MLS is slowly getting better about it’s longstanding lack of transparency and so now it usually admits how much money (or fake money) changed hands in transactions, and for foreign transactions often the other party will announce it even if MLS doesn’t, but there was still one transaction where all the Crew would say about acquiring Dylan Chambost is that there was an “undisclosed fee” (after some research, I considered it a free agent move because I think the fee was minimal).
Then there’s the fact that player salaries are a huge part of the compensation picture. Thankfully, the MLS Player’s Union releases these numbers…but they won’t do that for a couple of months, so until then, I don’t know what the total cost of new players are.
Because of problems like this, I’ve followed the league for two decades without really understanding the big picture about transfers. I think many fans around the league feel the same way.
Well, I’m sick of it. Today I’m going to power through these problems as best I can.
Transfer Fees
I’ll start with transfer fees. Like I said, they’re almost always available now. I used Transfermarkt’s numbers as my main source. Not their made-up “valuations” of players, just the fees they record teams as having paid, which seem pretty accurate. They’re missing details like incentive add-ons and sell-on percentages, but whatever. It’s close enough.
Unfortunately, they’re in euros, which I know is ridiculous for a newsletter about MLS, but I didn’t want to have to think about historical exchange rates while doing everything else, so I didn’t try to convert them.
Right away there’s a fork in the road. The goal is to evaluate how rosters have changed, so shouldn’t I just look at the ongoing winter transfer window? I decided to also add the 2024 summer window into the mix. It closed so late in the 2024 season that many purchased players don’t have time to make much of an impact. Foreign players also frequently have an adjustment period, and now they’ve had a preseason with their clubs.
For this first chart, I’ve also bitten the bullet and grouped together some disparate mechanisms: foreign transfer fees, the new intraleague cash “trades”, GAM trades, and loan fees. We’ll look closer at those things in a moment, but for now, let’s just look at the big picture.
I’ve got to admit, until I was painfully cleaning up this data, I had no idea so many teams have been spending so much on transfer fees. As a DC United fan, just the idea that DC United is paying any transfer fees at all feels new and special. But it turns out everyone’s doing it.
Well…not quite everyone. Sorry, NYCFC and Toronto fans.
I know people are going to want to use this to grade ownership groups, but remember, this is just a snapshot. Reporters expect Columbus to splash a bunch cash on a Cucho replacement soon. Toronto’s owners paid a fortune—and continue to pay a fortune—for its two Italian DPs. Inter Miami spent a massive amount in transfer fees last season (not to mention salary) so this season’s moderate number is just maintaining their squad. Their salary spend is probably huge too.
While we’re here, you can see that most MLS teams transfer in players during the offseason window, even though it’s the slower window in the worldwide market. It would be interesting to see whether big dollar transfers succeed more often when made in the summer or winter…well, maybe someday we’ll look at that.
Transfer Mechanisms
Now I’m going to combine the windows and separate by the mechanism used. But first I’m going to bore you with some moaning about GAM trades. Again, when I talk about GAM trades, I’m not counting the new “cash trading”, those I am just considering as transfer fees.
For GAM trades, sometimes it’s pretty straightforward, like New England trading a ton of GAM to Miami for Leo Campana. But sometimes it’s complicated, like Paul Arriola going to Seattle for the GAM equivalent of pennies because he’s now on a “bad contract”. In that trade, Seattle also gave up a first round draft pick, and Dallas agreed to retain some of his salary on their books. How am I supposed to equate that to paying money to a European club? There’s worse still; don’t even get me started about draft picks and player+GAM swaps.
I thought I might want to show counts of players a team acquired, so when I made this data set, I filtered out most small GAM transactions. My north star here is trying to get a sense for where teams are changing their on-field product, e.g. their likely starters and maybe a few impact subs. Every window there’s a ton of very small GAM transactions for youth prospects and backup players that just aren’t important. We can just assume that each team has some well-below-average players available to serve as backups when there’s a cluster of injuries.
That assumption is, of course, not true. As a DC fan, I can tell you that for various reasons DC spent all of last year with only one healthy fullback. That didn’t turn out well! But for most league fans just trying to get an overview of how teams are doing going into the season, “DC United now has a backup fullback” is way, way too much detail.
Okay, so here is a transfer fee + GAM spend chart that only includes what I’m considering “important” players. That distinction is necessarily arbitrary but it’s basically fees that were over 300,000 euros.
The main surprise I had looking at this chart was how small GAM transactions have become compared to transfer fees. I know I filtered out a lot of tiny GAM trades, but most of the ones I included still look tiny! There were really only two big GAM transactions: Leo Campana to New England ($2.5 million GAM) and Jesús Ferreira to Seattle ($1.5 million GAM plus big escalators that aren’t counted in the chart).
As a side note, although there are a lot of inbound loan players, only a couple teams admitted to paying any loan fees and only Charlotte FC to anything sizable: a reportedly 2.7 million euro loan fee for Wilfried Zaha.
I already feel dirty combining transfer spending and GAM, but we’ve still got other important player acquisition mechanisms to consider. So let’s look now at player counts. This will tell us which clubs are using which mechanisms. Having these counts be intelligible is why I was determined to filter out the small GAM trades.
Since I also wanted to filter out unimportant free agents and loanees, I had to sin and use the Transfermarkt valuation to try to distinguish important players. I ignored any player without at least a 1 million euro valuation in their system. I know, I know, but it’s the best I could do!
This was worth a try, but I don’t feel like this helps very much. I think the most interesting points are at the extremes. San Diego is bringing in a whole lot of players. Makes sense! Likewise, many of the teams at the top were bad teams revamping rosters like New England, CF Montreal, FC Dallas, and DC United. But as usual with this post, you’ve also got LAFC up there.
Meanwhile, you can see Seattle choosing to use GAM trades instead of foreign transfers. It’s not reflected here, but they seem to specifically be going for high value American players. We’ll see how that works out for them.
Then there’s NYCFC. They are pulling the “investing in youth” maneuver, with a side of “we’ll spend more when the stadium is built”. They were decent in 2024 and had a young roster, so maybe their results will improve as their players develop? Makes sense, except Tom Bogert is reporting they’re about to sell Santi Rodriguez. That’s not official yet, though (later edit: it really happened!).
Anyway, for most teams, I think the players counts ended up too messy to be very helpful. That left me having to decide what to do for my big picture team table.
Going back through the free agents and loans, I’ve come to the somewhat difficult decision that it’s going to be easier to just ignore them. In theory, you could just slap the free agent’s Transfermarkt valuation alongside transfer fees paid and consider that the “value” added to the club, but looking at these valuations…no. There are a ton of allegedly 1-2 million euro free agents that are never, ever going to command a transfer fee like that.
Here’s a quick list of the free agents and loanees from the past two windows who Transfermarkt valued at three million euros or more: Wilfried Zaha (Charlotte FC), Pep Biel (Charlotte FC), Felipe Carballo (New York Red Bulls), Marlon (LAFC), Marco Reus (LA Galaxy), Mikkel Desler (Austin FC), Marcel Hartel (St. Louis City), Marcus Ingvartsen (San Diego FC), and Paddy McNair (San Deigo FC).
There’s some important players on this list! Going back a little farther, it’s worth noting the 2024 MLS MVP (Leo Messi) and the 2024 Golden Boot winner (Christian Benteke) were both free agent signings! How can we just ignore them?
My solution to this problem: if they’re important, they’re probably DPs, and I’m going to look closely at DPs in the next post in this series. If they aren’t DPs, or if they were briefly but then were bought down, well, they aren’t that significant. I’m going to acknowledge this will make me miss a few key additions and just focus on fees.
Spending on Offense
Now that I’ve decided to focus just on players for whom dollars or GAM was paid, it would be good to see which transferred players are going to impact offense, defense, and goalkeeping and thus potentially influence how teams change from their 2024 ratings. All we need to do is, ugh, distinguish who’s playing defense from offense.
Here I’m going to mix metaphors a little bit and use Transfermarkt’s listed position. With retention I was using FBref’s 2024 position since they were all players in MLS in 2024, but this isn’t available for inbound players from obscure leagues. All the same caveats apply. I’m sure Transfermarkt’s listed position sometimes won’t reflect where a player plays, but hopefully it’ll be close enough.
We’ll start by looking at spending on what I’m considering “offense” players (which includes central midfielders, as with the minutes charts, but this time it won’t include players who Transfermarkt marked as “defensive midfielder” since, unlike FBref, they surface that distinction):
Like last time, I’ve applied groupings as best I can. I knew to expect it going in, but the amount of spending that Atlanta has done is truly wild. And in general, the spending is much, much more uneven than team offensive output. From this, you’d think the bottom teams would barely be able to score a goal. And maybe that’s what’ll happen, but historically…somehow teams end up much more even than the spending would lead you to expect. It’ll be really interesting to see how these massive fees work out this season.
Now that there’s intraleague transfers, we also have teams like FC Cincinnati spending big on “proven” MLS players. Evander and Lucho Acosta have proven they can absolutely demolish MLS defenses, but whether they will or not…more storylines for us to follow.
I also cheated and included Evander to FC Cincinnati for $12 million and David da Costa to Portland for $6 million. I really should have left them off since they aren’t official yet, but they’ve been rumored for so long I wanted to see them in the numbers.
One other little note here is that FC Cincinnati spent a reported 2.5 million euros on the purchase option for Luca Orellano over the offseason. I included that, since it’s money they spent on the offense, but in this one case he was already on the team last year, so it’s not really an improvement. Hard to know how best to handle that, but it felt weird to leave it off, and it’s just a drop in the Cincinnati spending bucket anyway.
Spending on Defense
Now let’s look at the same thing but for defensive players:
Update: The original version of this post had Minnesota United as the top spender, but this was due to a data error on my part.
LAFC is the top spender with over six million euros, but this amount of spending would only reach the very bottom of the “High” category in my offense chart. It’s not a surprise that MLS teams spend way more on offensive players, but this is a good reminder.
Goalkeeping
No fancy chart this time. There was only one significant goalkeeper transfer: DC United’s transfer fee for 21-year-old Korean goalkeeper Kim Joon Hong. The team didn’t disclose the transfer fee (grr) but Transfermarkt thinks it was 480,000 euros. Other sites have claimed it was almost a million, but I used the Transfermarkt number for DC’s spending.
There were other goalkeeper moves, but none of them that met my significance bar. I assume Houston and Austin already had backup goalkeepers they liked, but this means that San Diego is starting its inaugural season with three historically backup-tier goalkeepers.
Full Rundown
Now I can finally combine everything from this article into another dense, colorful chart:
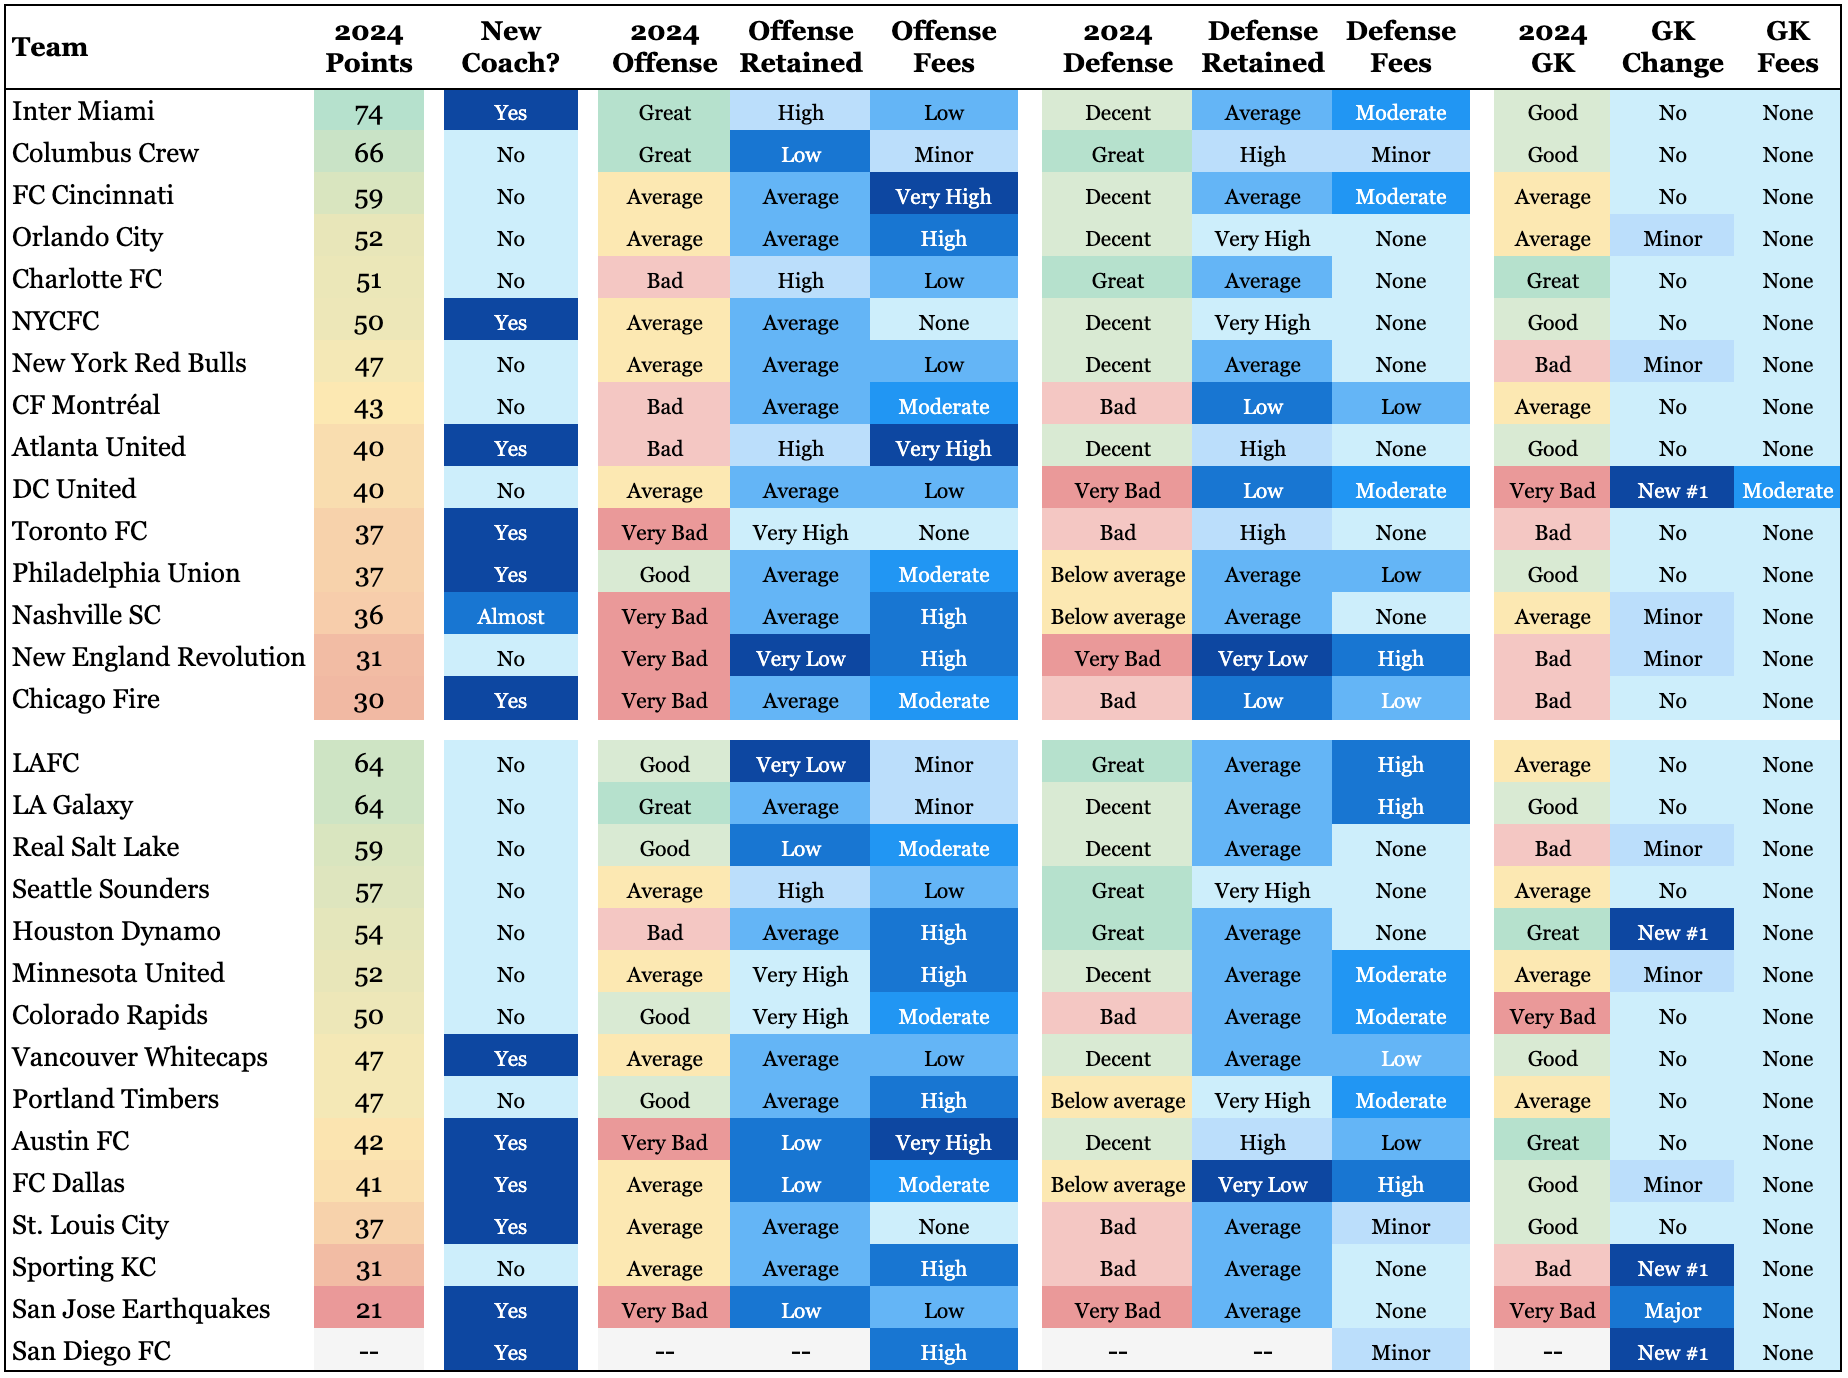
The red/green refers to quality in 2024, whereas the darker a blue, the more change in a given category.
When I started this project, I expected more correlation of changes to 2024 performance. Either the bad teams would be the ones making big changes or else the good teams would be the ones willing to spend money.
There’s at least a clear correlation with bad teams and coaching changes, but the Supporters’ Shield winners also have a new coach since Tata Martino decided to leave after one and a half seasons with Miami.
It’s a bit subtler, but I think for defenses there’s a correlation to 2024 outcomes as well. I labeled 16 teams as having “Decent” or “Great” defenses in 2024, and of these, only four teams spent even “Moderate” on defense. My interpretation is that MLS teams are always trying to juice the offense, but they only spend big on defense when there’s a big problem. I guess you could also throw in teams like Inter Miami and LA Galaxy where the offense is so good—and MLS roster rules sufficiently limiting—that they have no choice but to grudgingly spend on defense!
But there’s always complications to any story. LAFC was another team with a good offense who spent more on defense, but their minutes retained from the offense is very low, so how well will that work out for them? Then there’s FC Cincinnati, spending money all over the place.
I actually think it’s great that there really isn’t much of a pattern. Each team is a unique snowflake, trying to prepare for the 2025 season with a different set of constraints and strategies. As the season starts, I’m going to be using this information to make concise previews of games so that before watching your home team play—or a neutral game like the new Sunday Night Soccer matches—you can get a sense for what’s been going on with the teams you’re about to see play.
There’s not much time left before the season, but I’m still going to try to be back in a few days with a look at each team’s designated player situation. Subscribe for free to get that emailed to you as soon as it’s ready!
In the meantime, I’d like to ask every MLS general manager to please wrap up all blockbuster DP transactions as soon as possible! Thanks in advance!